

Docs / 4 Factors
There are 4 Factors which allow a company to value their sales pipeline. Taken individually, these factors do not make or break a sales team, but considered altogether, they will allow the sales team to accelerate their earnings.
The FACT is, a pipeline is driven by 4 key factors — the improvement of which guarantees an improvement in sales performance.
The 4 Factors are:
Flow
Average Sale
Conversion Rate
Time to Close
FACT = Sales
When FACT is increasing, sales is increasing — without exception. Therefore, if you are not hitting your sales targets, one or more of the FACT variables in your business is declining or insufficient.
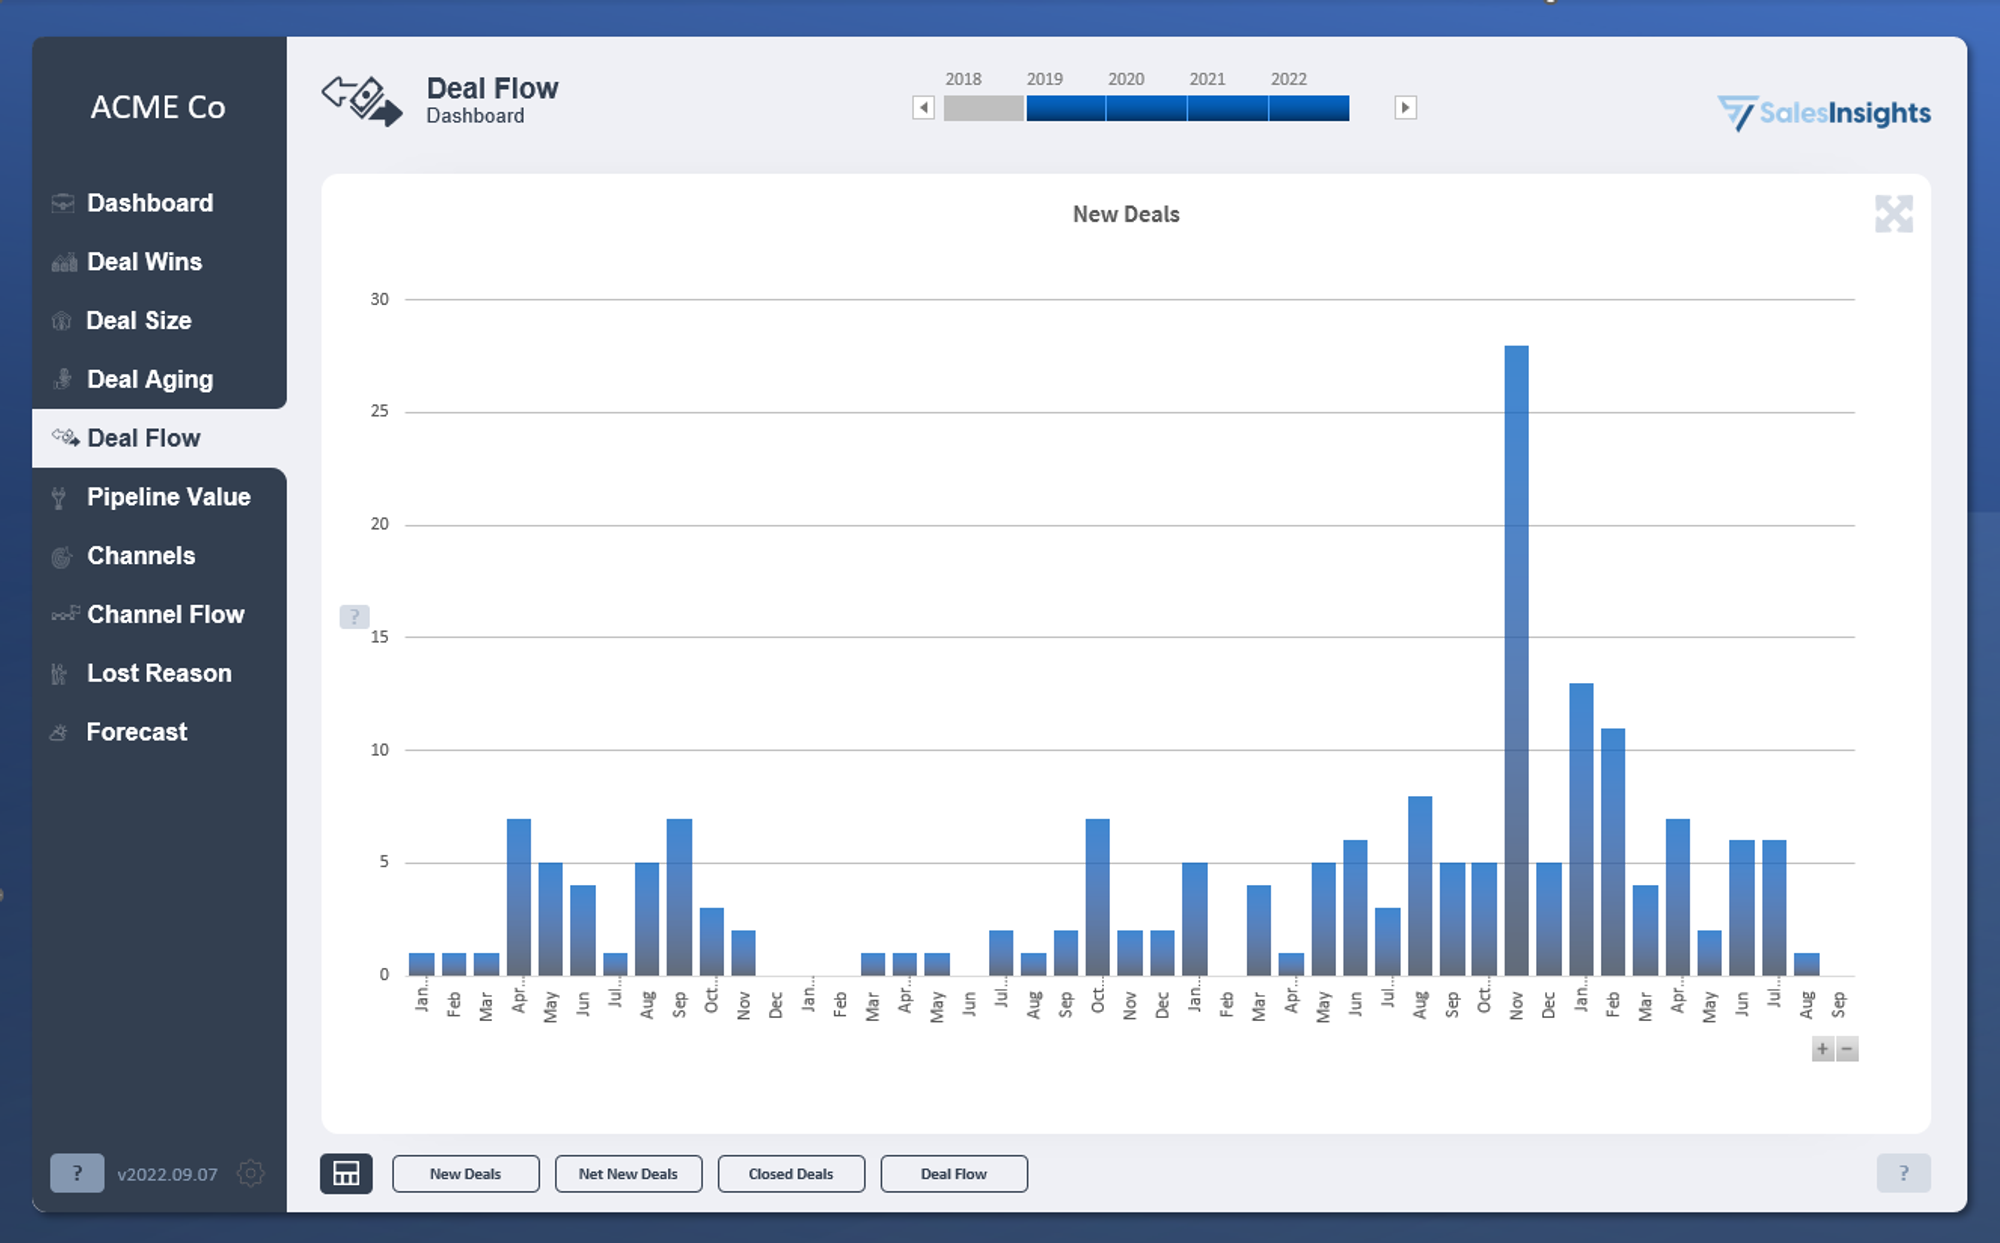
Flow
Flow refers to the newly qualified deals that have entered the pipeline. Ideally, a sales team should have a consistent number of new deals entering the pipeline any given month. An inconsistent flow of new deals will lead to inconsistent wins.
Average Sale
The Average Sale is the average sale value of deals that have been won.
Over time, a sales team should try to improve the Average Sale so that they make way into ever larger deals. All else being equal, for most businesses it is better to sell larger deals.
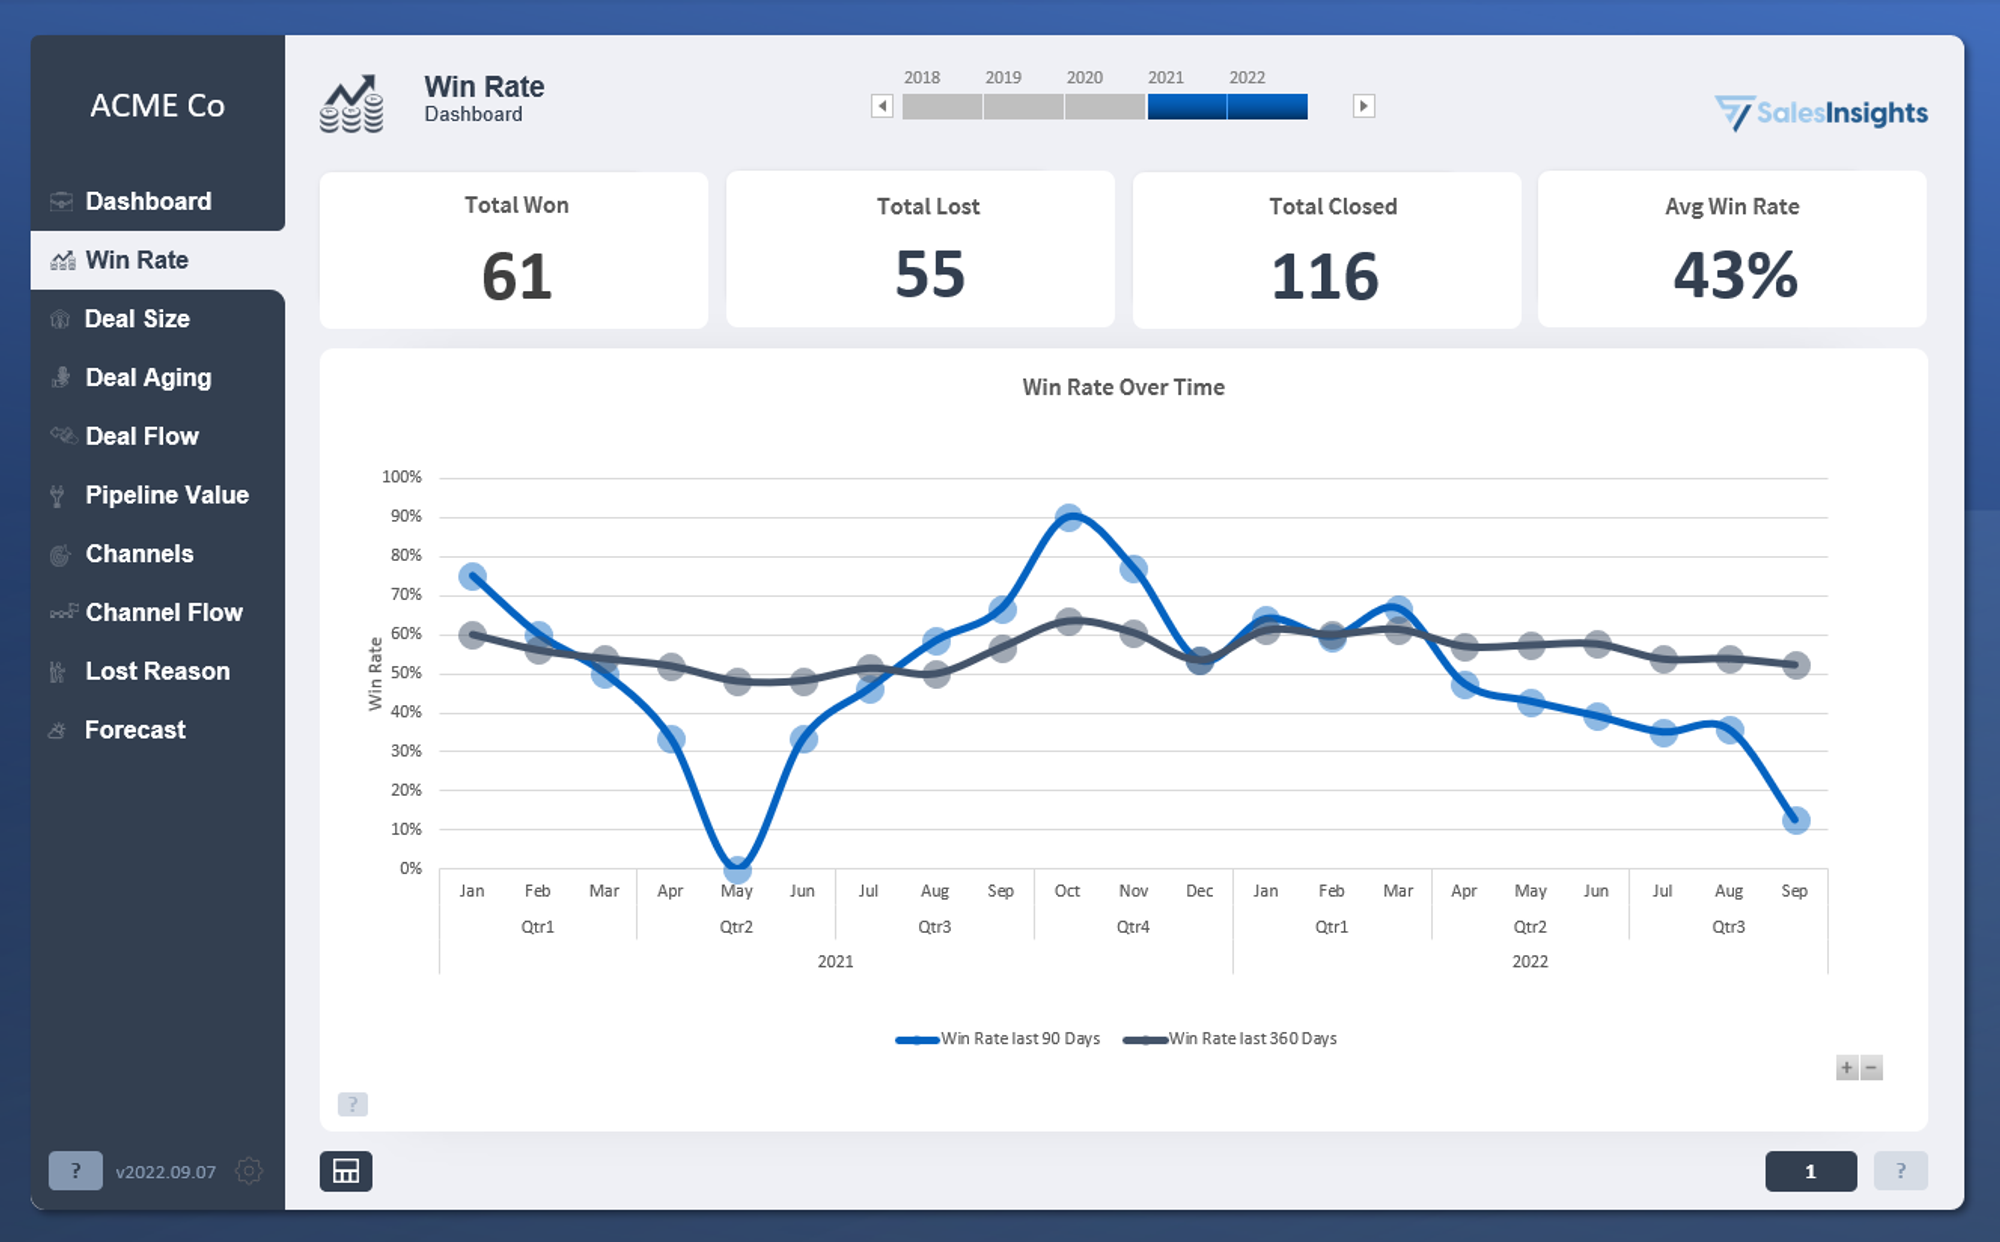
Conversion Rate
Conversion Rate, also known as Win Rate, is the number of deals won out of the sum total of won or lost deals in a period.
Conversion Rate does not take into account open deals
Over time a sales team should see Conversion Rate increase as they are developing their skills, as the marketing team is improving their targeting, and as the delivery team is improving their operations.
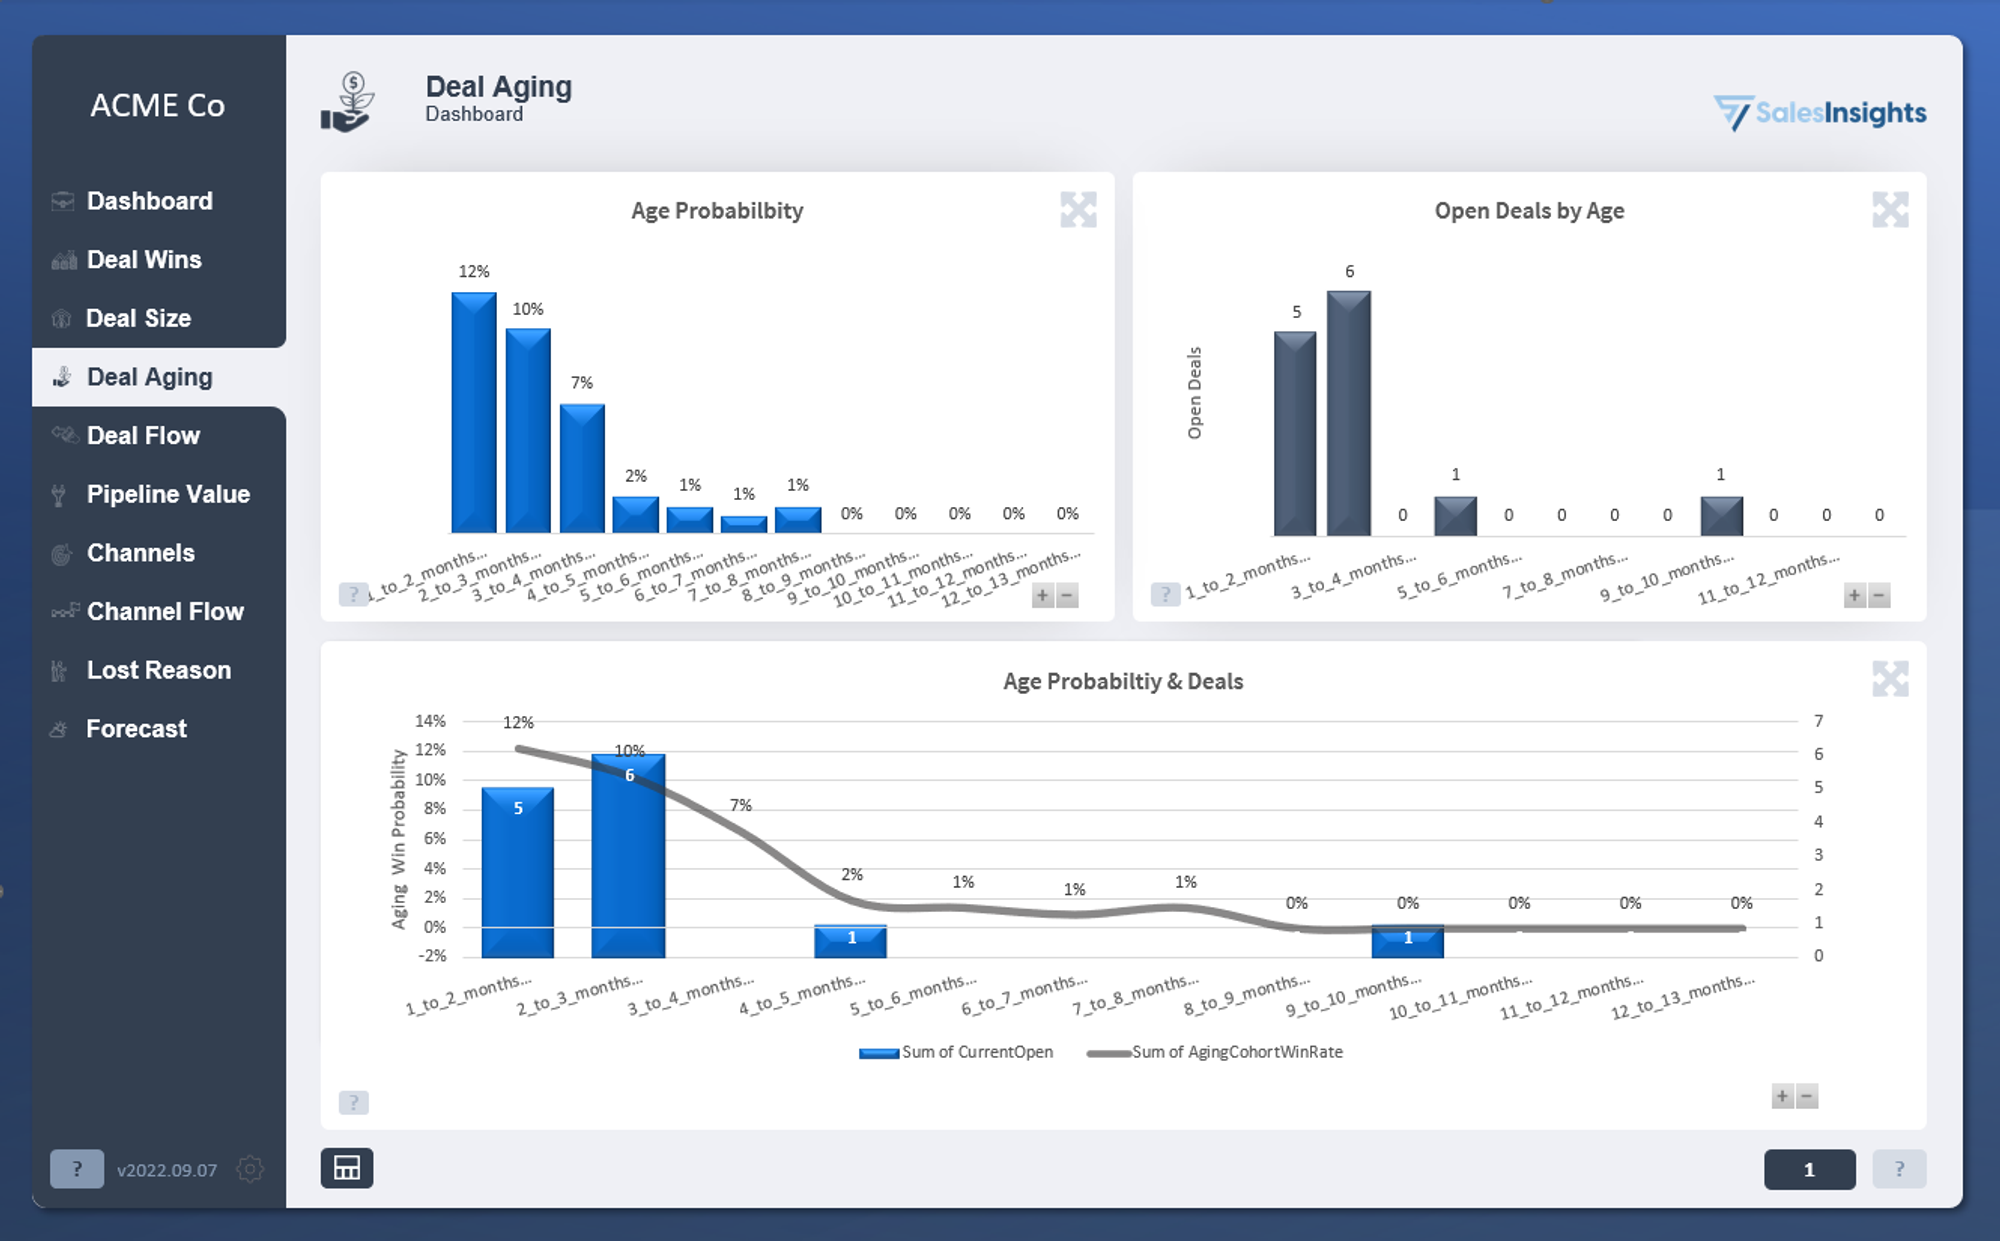
Time to Close
Time to Close is how many days a deal takes to close, and is also known as aging. For many businesses, the older a deal becomes, the less likely it is to win. The specific distribution of ages is known as the Aging Schedule. In some businesses, the probability increases for some time before then decreasing.
The average age of the deals determines how young or old a pipeline is relative to that businesses’ ideal pipeline. When we say that a pipeline is ‘young’ this means it has a lot of potential wins remaining, and an ‘old’ pipeline has almost no potential wins left. Knowing the age of the deals therefore allows the team to see if they are spinning their wheels on deals not likely to win.
Getting into the FACTS
Now that you know the 4 Factors of the FACT framework, how can you use it to improve your sales pipeline? Think about the areas where you can take action to improve each factor and what the resulting impact might be on your sales performance. For each factor, consider what metrics you can track to measure progress and how you can use these metrics to make informed decisions that will help increase sales.
Flow
- Increase the number of leads generated through marketing and sales activities
- Monitor and optimize lead quality through lead scoring and qualification
Average Sale
- Increase the price of products and services
- Cross-sell and upsell to existing customers
Conversion Rate
- Improve targeting and segmentation to ensure messaging is relevant
- Train and equip sales reps with the skills and resources needed to close deals
Time to Close
- Set and manage expectations with customers in the sales cycle
- Streamline and automate processes to reduce time to close
Test your FACT Knowledge
Q. What is Conversion Rate?
A) Conversion Rate is the number of Deals Won divided by the number of Deals Closed.
B) Conversion Rate is the number of Deals Lost divided by the number of Deals Closed
C) Conversion Rate is the number of Deals Won divided by the number of Deals Open
D) Conversion Rate is the average sale value of Deals Won
Correct Answer
A) Conversion Rate is the number of Deals Won divided by the number of Deals Closed
Q: What is the acronym for the 4 factors that are used to value a company's sales pipeline?
A) FATS
B) FRAC
C) FACTS
D) FACT
Correct Answer:
D) FACT
Q: How can a company increase their Average Sale?
A) Decrease the price of products and services
B) Reduce customer service quality
C) Cross-sell and upsell to existing customers
D) Outsource services
Correct Answer:
C) Cross-sell and upsell to existing customers
Q: What metric is used to measure the success of the Conversion Rate?
A) Conversion Ratio
B) Win Percentage
C) Win Rate
D) Loss Rate
Correct Answer:
C) Win Rate
Q: What is the term used to describe how many days a deal takes to close?
A) Deal Duration
B) Closing Period
C) Time to Close
D) Deal Aging
Correct Answer:
C) Time to Close

ObjectiveSalesManagement.org maintains the documentation of the OSM model and provides training certification for Partners and clients that wish to use OSM within their businesses.
OSM Training
Get in depth training on OSM and sales team performance with a Training Partner
Deploy OSM
Deploy OSM in your organization today with SalesInsights.io. Sales Insights can audit, clean up, report, and improve your sales team performance.
© Objective Sales Management 2022